Net Revenue Retention vs ACV: The Metrics Your Board Actually Cares About
Growth gets you in the room. Net revenue retention decides your valuation. Here is why boards weigh these two metrics so differently, and how to move both.
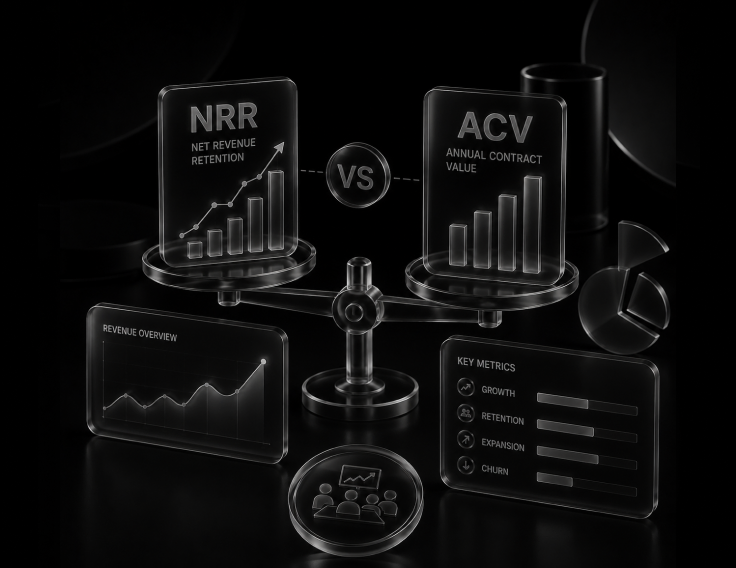
New logo growth used to be the number every board meeting opened with. It still gets mentioned first, but it's not the number that decides the multiple anymore. That job increasingly belongs to net revenue retention, a metric that measures something growth alone can't: whether the business you already built is getting stronger or quietly eroding underneath the new deals.
Annual contract value tells you how big your average deal is. Net revenue retention tells you what happens to that deal after it's signed. Both matter, but for very different reasons, and conflating them is one of the more common ways leadership teams misread their own board decks.
What each metric actually measures
ACV is simple: the average annualized value of your contracts. It tells you who you're selling to and how big your average customer is. A rising ACV usually means you're moving upmarket, closing bigger accounts, or successfully packaging more value into each deal.
NRR measures something different: how much revenue you keep and grow from your existing customer base over a period, completely excluding new logos. The formula subtracts churn and contraction from your starting revenue, then adds back expansion. Because expansion is uncapped, NRR can exceed 100 percent, meaning your existing customers alone are growing the business even before a single new deal closes.
The distinction that matters: ACV tells a board what kind of company you're building. NRR tells them whether that company is getting healthier or sicker over time. A board can forgive a modest ACV. It has a much harder time forgiving retention that's quietly declining.
Why NRR moved to the center of the valuation conversation
The data on this is unusually consistent across sources. One widely cited McKinsey analysis of more than 100 B2B SaaS companies found that top-quartile performers on net revenue retention traded at a median enterprise-value-to-revenue multiple of roughly 24x, compared to about 5x for bottom-quartile peers on the same metric. That's not a marginal difference. It's close to a five-fold gap in how the market prices two companies that might otherwise look similar on paper.
The reason is mathematical as much as psychological. NRR compounds. A company holding 120 percent NRR grows its existing customer base into a meaningfully larger revenue pool over just a few years with zero new customer acquisition. Investors aren't paying for this quarter's number. They're pricing in the trajectory that number implies.
Why benchmarking NRR against a single number is misleading
A common mistake is comparing your NRR to a single industry average without accounting for your ACV tier. Retention behaves very differently depending on deal size. Enterprise contracts, with deeper integrations and higher switching costs, consistently post higher NRR than SMB-focused businesses.
That means a self-serve SMB product sitting at 100 percent NRR might be performing reasonably well for its segment, while an enterprise platform at the same 100 percent could be meaningfully underperforming its peers. Context matters more than the raw number.
"A metric without a peer group to compare it against is just a number. Context is what turns it into a signal."
The connection between ACV and how NRR gets built
Higher ACV doesn't just correlate with higher NRR by coincidence. It reflects a different kind of customer relationship. Larger contracts typically involve deeper implementation, dedicated support, and a genuine partnership between vendor and customer, all of which make a customer both harder to lose and easier to expand.
This is part of why so many B2B SaaS companies deliberately move upmarket over time. It's not just about bigger deals closing faster. It's that bigger deals tend to come with structurally better retention economics attached, which compounds into a healthier NRR profile without requiring anything to change about the product itself.
What to bring to your next board meeting:
- What's your NRR by ACV tier, not just blended across the whole customer base?
- How much of your NRR movement came from expansion versus reduced churn, and which lever needs more investment?
- What share of your churn is involuntary, and is that being tracked separately from deliberate cancellations?
- Does your pricing model create a natural path for expansion revenue, or does every account increase require a manual renegotiation?
The bigger picture
ACV answers the question "how big is this business." NRR answers the much more important question: "is this business getting stronger or weaker underneath the new deals." Boards have learned to weight the second question more heavily, because it's the one that predicts whether growth is durable or borrowed against tomorrow's churn.
Track both. But when the two metrics tell different stories, believe the one that measures what happens after the ink dries.
Author
Jordan Lee
Head of Revenue, Module